The parcel that scored high on paper and failed on the ground
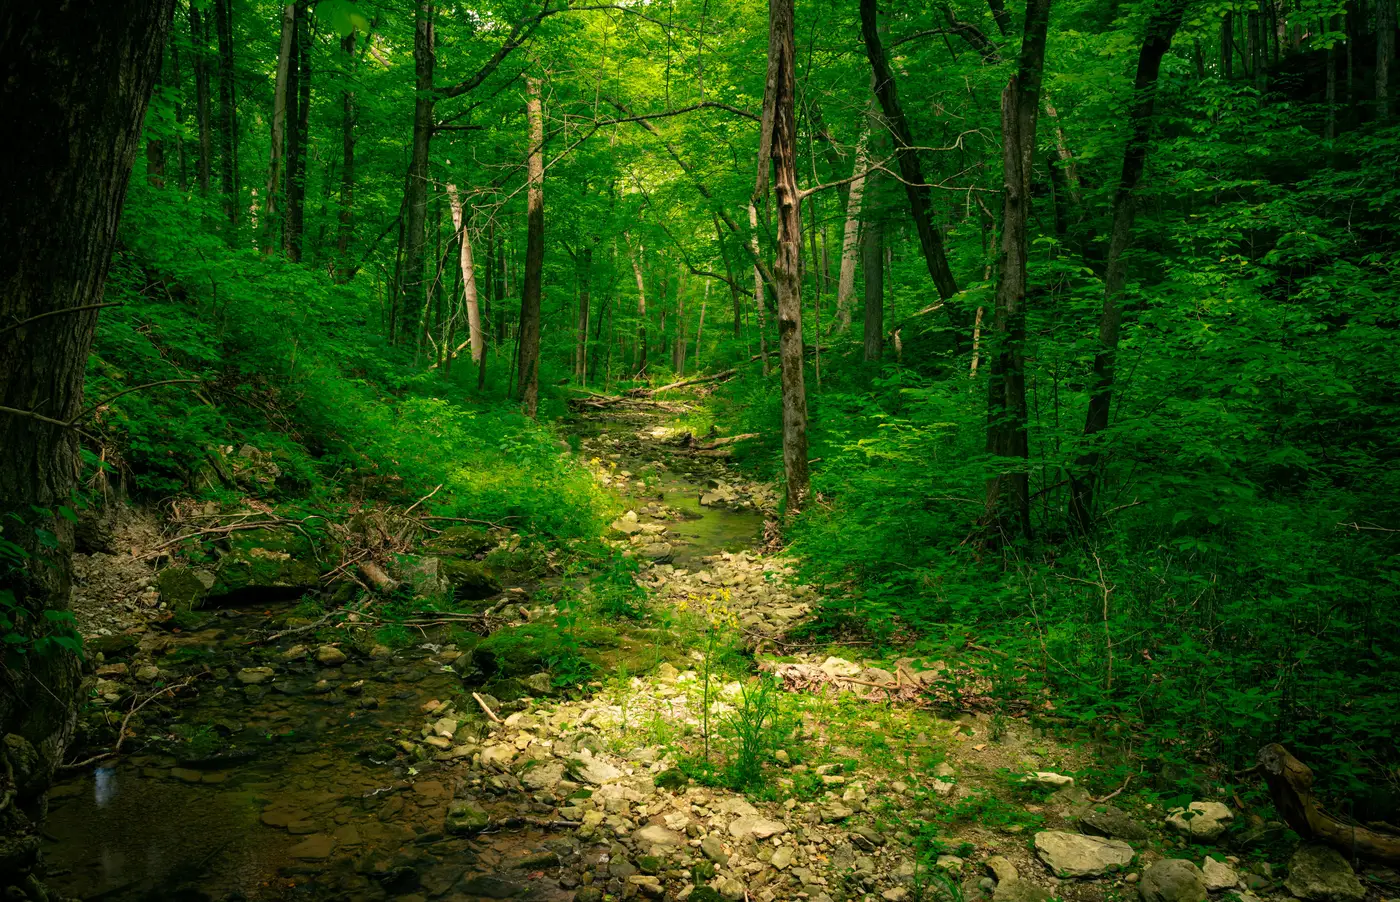
We flagged the parcel in the first week of screening. Forty-one acres along a second-order tributary, patch size in the top quartile for the watershed, edge density low, a connectivity score that put it ahead of three sites we'd already started scoping. On the land cover classification it read as a mature bottomland hardwood stand with a clean link to a documented wildlife corridor half a mile upstream. We ranked it first. I drove out two weeks later expecting to confirm what the data already told us.
What I found was a stand that had been high-graded twice since the aerial imagery's reference date, an understory thick with Chinese privet that doesn't show up as anything but "forest" in a land cover class, and a drainage ditch cut along the eastern boundary sometime in the last decade that had quietly rerouted half the site's hydrology away from the tributary. The patch was still there. The canopy still closed over most of it. But the thing that made it valuable on paper, a functioning bottomland system tied into a corridor, had been unraveling on the ground for years in ways no classification layer was built to catch.
This isn't a complaint about the tool. Patch size, edge density, and connectivity are real signals and they do the job they're supposed to do: they tell you where to look first. The mistake was mine, treating a screening output like a verdict instead of a shortlist. A desk screen can tell you a parcel has the bones of a good offset site. It can't tell you what's actually rooted in the understory, whether the hydrology still functions the way the topography suggests it should, or what happened on that property between the satellite pass and your site visit. Those are ground-truth questions, and no amount of spectral resolution answers them from altitude.
The failure mode I see most often on projects like this one isn't a bad data source. It's skipping the step between the ranked list and the field boot. Teams get a clean metrics table, see a site at the top, and start writing it into a mitigation plan before anyone has walked the boundary. The land cover classification is current as of its flight date, not as of this morning, and a lot can happen to a forty-acre tract in a growing season, let alone a year. Grazing leases change, or someone clears a fire line. An upstream culvert fails and the whole hydrology of a parcel shifts without anything visible in canopy cover.
Remote screening saved us time on this project by narrowing the field fast. We ran the fragmentation metrics across the full study area, cut our candidate list from around twenty parcels to five based on patch size and connectivity alone, and only then spent field days on the ones worth the drive. The parcel that failed on the ground was still a useful stop. It cost us a day, not a season, because we'd already ruled out fifteen other sites before we got in the truck. A desk screen's value is the triage: it keeps your field time pointed at the sites with the best odds.
If you're building that shortlist now, Habitat Suitability turns an annual land cover classification into exactly that kind of candidate list, patch size, edge density, and connectivity between habitat blocks, scoped to the study area you define, before anyone commissions a bespoke survey.
The site that looks right on the metrics table still needs a pair of boots on it before it goes in the plan. Start the shortlist there, and let the field visit do the rest.